
In FinTech, metrics hold meaning beyond numbers; they signal trust, reliability, and user confidence. As opposed to traditional SaaS products, FinTech products are utilized in a regulated environment where every action a user takes involves a financial and emotional risk. Tracking the right metrics for FinTech helps for performance, and ensure stability, adherence to compliance, and trust at scale.
The following metrics are the most important product metrics for FinTech teams, framed in six categories: Core Product Metrics, Customer Experience Metrics, Delivery and Product Health Metrics.
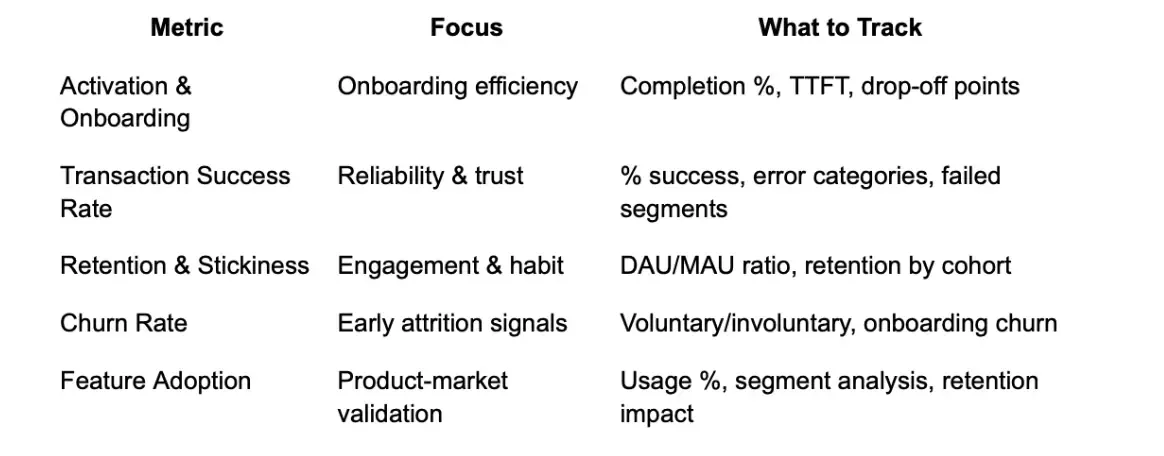
Core Product Metrics
1. Activation and Onboarding: The Trust Barrier Moment
Activation and time to the first transaction (TTFT) help to assess how fast users reach their “aha moment.”
Onboarding can often be convoluted within FinTech and necessitates considerations for KYC, document verification, and linking a bank account. Each additional step adds another risk to user drop-off. Scaling down TTFT directly benefits trust and retention, as users perceive good onboarding experiences to be more trustworthy.
What to track:
- Percent of users who complete onboarding
- Average time to first transaction
- Where do they drop off at each additional onboarding step?
2. Transaction Success Rate (TSR): Your Fundamental Indicator of Reliability
When your users cannot transfer money, you lose them—that fact is true. TSR indicates the percentage of transactions that are successful and is a leading indicator of your technical and operational reliability. Every failed transaction reduces user confidence and can lead to churn. A high TSR shows that your architecture is resilient, fallbacks are well-tested, and your third-party integrations are reliable.
What to track:
- Overall % of transactions successfully completed
- Categories of failed transactions (expired card, API error, partner downtime)
- Transaction errors by segment
3. Churn Rate: Your Quiet Fire Alarm
Churn Rate is the percentage of users who discontinue use of your product. In FinTech, churn is more than merely a retention metric — it's a trust metric. Users leave not because of a bad or buggy UI; they leave because a payment failed, support wasn't helpful, or they doubted the security of their funds and information. Monitoring churn throughout the user journey enables proactive measures to be taken before the attrition turns from individual departures to mass drops in users.
What to measure:
- Voluntary vs. involuntary churn (such as failed payments)
- Churn during onboarding
- Churn following critical lifecycle moments
4. Feature adoption: Validating the product-market fit
Feature Adoption shows whether the features provided real value. In FinTech, it is often true that feature usage directly correlates with revenue and retention. Tracking feature adoption allows product teams to be(sic) able to prioritize the most impactful features towards compliance, retention, or monetization efforts, and sunsetting those features that don’t.
What to track:
- % of users adopting core features
- Adoption by segment (e.g. SMBs, high-value customers)
- Correlation of adoption to retention and ARPU
Core Product Metrics Overview
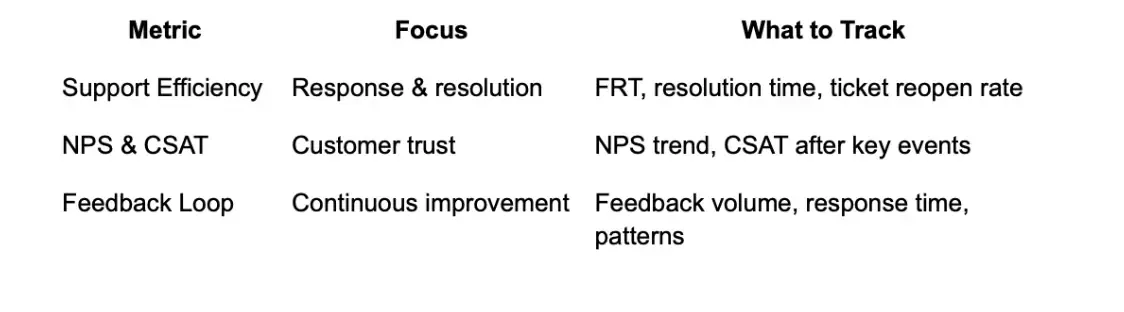
Customer Experiences Metrics
1. Customer Support Effectiveness
In FinTech, customer support provides a foundation for your trust structure. Metrics such as response time, resolution rate, and number of escalated issues provide insight into the level of support your product is offering to users experiencing issues.
What to track:
- Average first response time (FRT)
- Average resolution time
- Resolved vs. reopened tickets
2. Net Promoter Score (NPS) & Customer Satisfaction (CSAT)
These services assess trust and advocacy. A high NPS in FinTech typically indicates that a user feels safe, informed, and supported. Measuring satisfaction after meaningful interactions also indicates product and process shortcomings.
What to measure:
- NPS over time
- CSAT after key interactions
- Trends in promoters vs detractors
3. User Feedback Loop
Qualitative feedback: reviews, open text fields, community discussions is a good source of early warning signals. Setting up a feedback loop will increase the chances that product, compliance, and support teams act on using your input and insights quickly.
What to measure:
- Number of responses of feedback analyzed each month
- Time to change, average response time
- Recurring themes of feedback
Customer Experience Metrics Overview
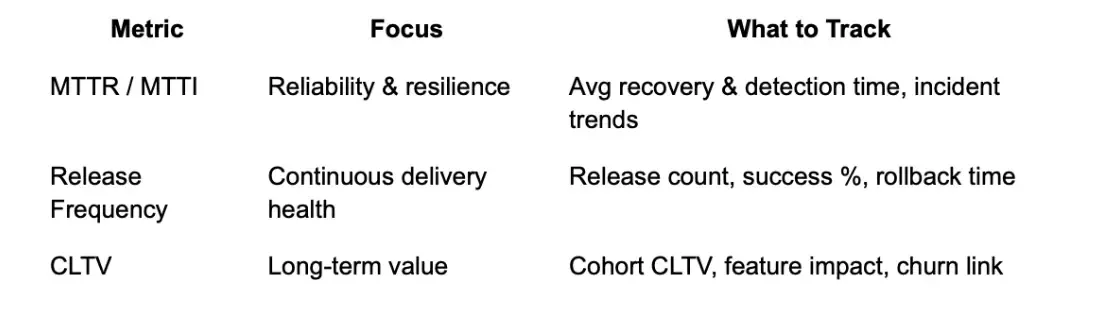
Delivery and Product Health Metrics
1. Mean Time to Restore and Mean Time to Identify
The Mean Time to Restore (MTTR) and Mean Time to Identify (MTTI) metrics measure how quickly teams recover from and detect incidents, respectively. When services go down, teams lose both trust and money.
What to measure:
- Average recovery time
- Average detection time
- Incident type trends
2. Release Frequency and Deployment Health
Release frequency and service stability is a sign of a healthy delivery. The more frequently you release a service, the better its compliance and reliability will be.
What to measure:
- Number of releases per month
- Percentage of releases that were successful
- Average rollback time if applicable
3. Customer Lifetime Value (CLTV)
Measured as the total potential value to the company of a user during the time that they experience the product. It guarantees that product, retention and marketing strategies all work together to maximize value.
What to measure:
- CLTV by cohort
- Effect of new features
- Impact on churn or retention
Delivery & Product Health Metrics Overview
Conclusion
In FinTech, metrics serve more than just a measurement; they also convey trust. Each metric, from onboarding to delivery is a reflection of how well your product adapts, protects, and services its users. By understanding the right metrics, you create transparency for your users, stakeholders, and regulators showing not only your product is growing, but growing responsibly.
Data and metrics alone do not drive success. Actions refined from data do.
Don't simply measure: learn, act, and adapt.